
Learning on the Fly: Sabermetrics 101 – wRC+ and RE24
The Value of Creation and Expectancy
After an admittedly long sabbatical from Outfield Fly Rule, I realized how much I missed learning about (and sharing) what the more popular advanced metrics mean. Today, I want to look at wRC+ and RE24. Both are offensive based metrics that I think give a better picture of how much overall value a player provides with a bat in his hands.
Weighted Runs Created – Plus (wRC+)
Basically, wRC+ accounts for specific batting outcomes (for instance, the value of a double, single, home run, walk, etc). It also accounts for park factors, thus, the plus (+) annotation. We know that every park plays differently, and that hitting in some parks is easier than hitting in other parks. To properly evaluate players, we have to account for those differences, and wRC+ does. Like many of these kinds of metrics, the league average for each year is set to 100. Anything above or below 100 is equivalent to a percentage point better or worse than the league average. So, if a player has a wRC+ of 85, that player is 15% below the league average hitter at creating runs. Likewise, someone who has a wRC+ of 150, is 50% better than the average hitter at creating runs.
Calculating wRC+ is no easy task. I can hardly figure out the formula, let alone explain it. However, I can do is further explain what it covers. wRC+ is a relative of – what else – wRC. Weighted Runs Created (wRC) is an effort to quantify total offensive value, minus park factors. Essentially, you’re calculating a total run value for one player. More simply, it’s literally how many runs did this player produce or create for his team. Creating runs is the name of the game for a batter, so knowing how often he does that is good to know.
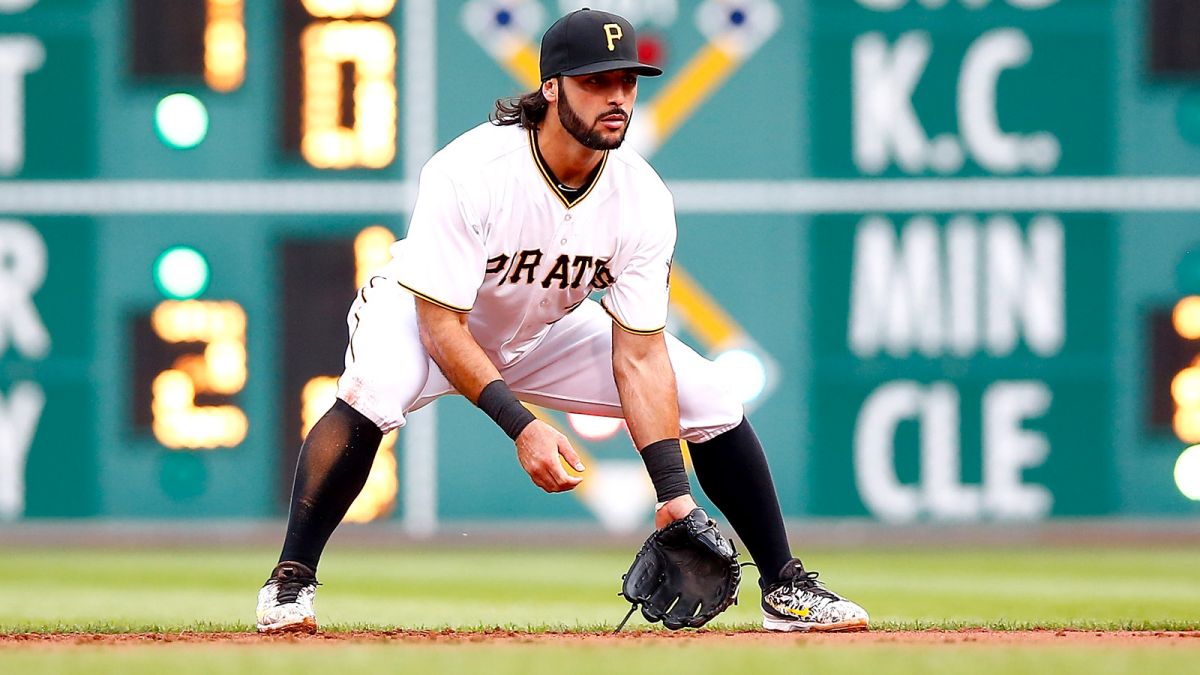
wRC+ tells us a lot about how valuable a hitter is. However, players sometime over-perform against their career averages. An example of this would be the Braves Sean Rodriguez.
Rodriguez had a good 2016 with the Pirates where wRC+ is concerned. His wRC+ for that season was 129. This wRC+ of 129 was amassed in 342 plate appearances, so he played enough to have somewhat reliable sample size, but it was a lot fewer plate appearances than the rest of his career. Now, I’m not saying Sean Rodriguez is a bad player, but his wRC+ totals prior to 2016 were quite different:
- 2015: 78 wRC+
- 2014: 97 wRC+
- 2013: 99 wRC+
- 2012: 71 wRC+
- 2011: 94 wRC+
- 2010: 96 wRC+
For his career, he has a wRC+ of 92.
Are those bad numbers? Not necessarily, but they are below league average. So, is he a valuable hitter? Well, it depends on what you are looking at and looking for. What the Braves were/are hoping for, is the Sean Rodriguez of 2016, not 2015. This doesn’t take away from what Rodriguez did in 2016; he made significant mechanical changes to his hitting approach. Could his radical adjustment be the reason for the big uptick? Could it be a fluke? Maybe, but hopefully for Atlanta’s sake, it’s the former.
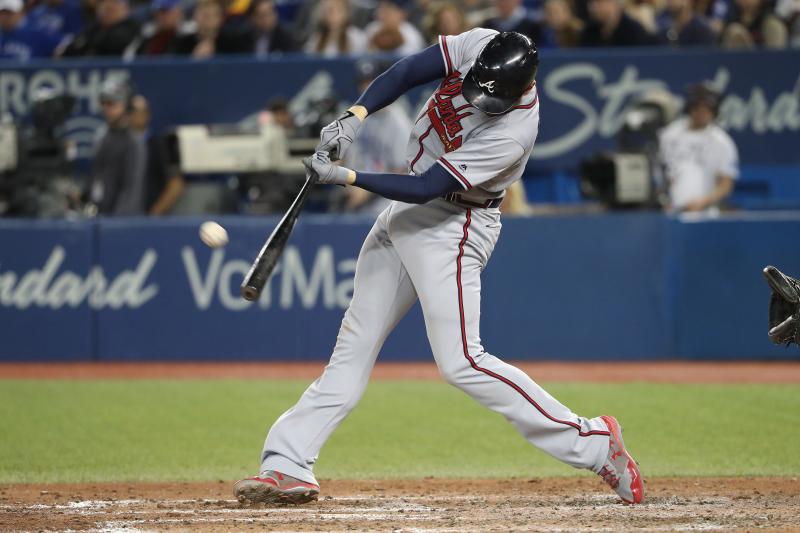
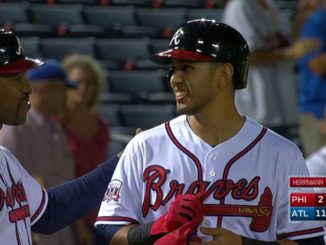
Nick Markakis, while with Baltimore, averaged a 112 wRC+. In eight of his nine years there, he had a wRC+ over 100, which is better than average. With Atlanta, he has had seasons of 106, 98, and a 98 so far in 2017. “Kakes” is a career 110 wRC+ player. It’s safe to say that in the wRC+ department, Kakes has regressed, which is not surprising considering his age and decline in power.
Let’s look at Atlanta’s best hitter, Freddie Freeman. If we’re just talking wRC+, just this year Freddie has a wRC+ of 167. This means he’s 67% better than the average hitter at creating runs. His 167 wRC+ is a career best, and we’re just into August. Plus, he missed 7 weeks this year with his arm in a cast. In case you were wondering, Freddie’s previous career high was set last year. He had a wRC+ of 152 last season.
Of course, as we know, you shouldn’t use just one stat, traditional or advanced, to tell the story of a guy. You need other variables to get a more rounded understanding of a hitter. I’m still getting my feet wet with the advanced stuff, but as I learn, I can use more and more metrics to give me a better understanding of a particular guy.
So, after all this, why wRC+? Why not slugging? Well, how about I let OFR contributor Micah Smith explain:
“What it does is similar to slugging, but better because instead of arbitrarily weighing a double as twice as valuable as a single in its formula, it uses the actual increase – on average – in the expectancy of a run scoring based on the outcome of the plate appearance, and that includes outcomes slugging arbitrarily leaves out like walks and hit by pitches. It does it by considering how that outcome contributed to runs scoring across all plate appearances in real baseball games. That doesn’t mean in that specific plate appearance, 1.232 runs (the value of a double in 2017) were created because Batter X hit a double; instead, it means across all batters hitting doubles, the run expectancy increased from 0 to 1.232, and that becomes the weight given to all the doubles for a batter instead of the arbitrary 2 used in the formula for slugging. So while SLG is arbitrary, wRC+ is based in real outcomes and much closer to reality.”
So instead of singles being multiplied by 1, and a double multiplied by 2 because it sounds good, singles are multiplied by .876, and doubles are multiplied by 1.232 because that’s how much they increase the expectation that a run will be created based on taking real outcomes of actual games played. To see the table of weights, you can check them out at FanGraphs’ GUTS page.
wRC+ is a rate stat meaning that the value is a ratio of outcomes divided by opportunities. For example, batting average is a rate state because it divides number of hits (outcomes) by number of at bats (opportunities). The thing you have to watch out for in rate stats is small samples. Like a player hitting .500 in 10 plate appearances doesn’t mean the player is actually a .500 hitter, a player with a 200 wRC+ across 10 plate appearances probably isn’t twice as good as everyone else at creating runs, it just means during that small stretch, they were twice as good. To know their true ability, you need to see how they do over time. So watch sample size when saying, for example, Johan Camargo is the greatest player ever because he put up a 498 wRC+ across nine plate appearances July 8th and 9th. He’s not better than Freddie Freeman, whose put up a 172 wRC+ across his last 600 plate appearances.
Run Expectancy Based on 24 Base-outs States (RE24)
The best way I can simplify this is basically how many runs a player can be expected to produce in an inning. The number 24, according to FanGraphs, is “the potential number of base-out states (zero, one, two outs and eight different baserunner arrangements).”
RE24 is context dependent, meaning it gives more credit for hits with men on base, rather than the bases empty. So for instance, a Dansby Swanson single with men on base, is more valuable than a Dansby Swanson single with the bases empty. Unlike wRC+, where league average is set to 100, RE24 league average is set at zero. Therefore, a hitter with a positive RE24 means they are creating more runs than we would expect in any particular situation. Alternatively, a negative RE24 means a certain player is creating fewer runs than we would expect in those same situations.
Also, RE24 is not hitting specific. It is used with pitchers as well. But for now, we’ll stick to the hitting aspect of RE24. For hitters, RE24 is a metric that tells you if hitters are making the most of the opportunities given. Let’s go back to Sean Rodriguez for a moment.
2016 was a good year for Sean. He finished that year with a 10.70, but in 2015 he had a -18.71. So far with the Braves, in his extremely small sample size, he has a RE24 of -1.55. Remembering that zero is the average, Sean appears a very inconsistent performer. When you figure wRC+ into the equation, the inconsistencies stand out a little more.
Sean’s -1.55 RE24 tells me that when he comes up in situations where runs can be produced, he’s actually hurting the team. However, if we go back to Markakis, he actually has a RE24 of 7.48 in 2017. In 2016, Kakes was at 10.97. Freddie Freeman? In 2017, he has a RE24 of 25.29 and in 2016 it was 46.49.
You may have noticed this, but unlike the rate stat of wRC+, RE24 is a counting stat. That means that it is not being divided by opportunities, but instead is simply added or subtracted as it is accumulated. Other more basic counting stats are Home Runs and RBI’s. Every time one is earned, you add it to the others and it’s not divided by plate appearances or anything else to make it a rate stat. The thing you have to watch out for with counting stats is comparing two players based on the numbers when they have a different number of opportunities. For instance, we can’t say Sean Rodriguez has less power than Freddie Freeman because Rodriguez only has two homers and Freeman has 19. That’s not a fair comparison because Rodriguez only has 40 plate appearances to Freemans 271. No, we know Freeman has more power for many other reasons over many more career plate appearances.
In their careers, Sean Rodriguez has a -48.28 RE24, and his only season with a positive RE24 was in 2016. Nick Markakis is at 117.99 and Freddie Freeman has an astounding 232.88 RE24. So what does this tell me? If I’m just using RE24 and wRC+ to evaluate these three hitters? Well, It tells me that possibly, Sean Rodriguez’s 2016 was a fluke (but small sample size makes that uncertain), Nick Markakis is regressing, and Freddie Freeman is only getting better.
If I’m using these metrics, I get a better idea of how these players are valued on the offensive side. Obviously, I can’t use just these two metrics. But, it gives you an idea of what kind of value you can get from these kinds of players. It also has to make you think, when team front offices look at trades, do they use these numbers to justify value leaving or value coming in?
I hope this helps you understand just a little bit about these two metrics. I can’t promise you an in-depth, detailed breakdown of these as I am still learning them myself, but this is more of an introduction to maybe pique your interest. Hopefully, the time between the next metrics review, won’t be so far apart.


Leave a Reply