
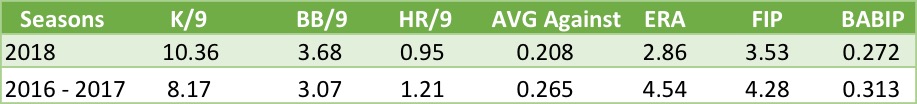
Mike Foltynewicz is having an exciting season. Sporting a 2.86 ERA buoyed by a 3.53 FIP, it’s by far the best effort of his career. Foltynewicz was part of the first wave of starting pitching acquired in the Braves’ rebuild. The early returns from this group of pitchers were not good, as fans watched hurlers like Foltynewicz, Matt Wisler, and Aaron Blair struggle to establish themselves.
So this turnaround from Foltynewicz – along with a similar about-face from Sean Newcomb – has been a welcome development for an Atlanta club that is playing significant games in the second half for the first time in a while.
However, with newfound success comes an irksome question, loathed by the homer in all of us. How much of this success is a real and sustainable increase in skill, and how much is just luck? We are right to defend how difficult it is to succeed in this quirky game that we love, but a great deal of chance and non-pitcher performance can sneak in behind the scenes and substantially affect a pitcher’s ERA.
So, let’s take a look under Folty’s hood. That’s not a double entendre or anything. Unless suggestive language will keep you reading longer, in which case, it gets even steamier below! (It definitely doesn’t).
My Theory On Mike Foltynewicz
Mike Foltynewicz had a nice streak at some point in 2017, and he happened to be throwing his curveball more during that span. Since then, I’ve been incubating a pet theory that the curve is the secret key to his success. Much to the chagrin of my ego, this theory… well, it just keeps not being true.
So what’s been driving him to new heights this season? Below is a summary of some basic facts on the ground, presented in point-counterpoint fashion. If not otherwise stated, the stats in this post are courtesy of Fangraphs.
- His K/9 rate is up to an elite level, good for 12th best among qualified starters at the time of writing.
- But… he’s also walking more batters than in the past.
- His HR per 9 innings are down!
- But… this is somehow true despite hitters raising their average exit velocity and average launch angle against him. Just ask Baseball Savant.
- Hitters’ batting average against him is waaaay down to an anemic .208, lower than his previous seasons!
- But he’s also sporting a minuscule batting average on balls in play, or BABIP, a key indicator of how lucky a player is once the ball leaves the bat. His current mark of .271 is about 25 points lower than the league average, and about 40 points lower than his career mark so far, suggesting some luck.
- However, hitters have struggled to an xBA of only .218, which serves to validate the very low actual batting average against.
- xBA is a Statcast metric that calculates expected batting average, based on where and how hard batted balls are hit. Check it out, also at Baseball Savant.
- The ERA is very good!
- But… it’s also a good bit lower than his Fielding Independent Pitching (FIP), which, especially coupled with the BABIP issue above, may suggest some good luck along the way in terms of run prevention.
- That said… his FIP is down a great deal from previous seasons, too, and this props up the notion that there is some real improvement here.
All this taken together, the big dips in Foltynewicz’s ERA and FIP are probably a little driven by good defense and some good luck. But at the core of this markedly improved run prevention, there seems to be markedly improved pitching.
It’s intriguing when a player appears to have figured something out, because there are so many styles of figuring it out. Sometimes they develop a new pitch! Sometimes the old pitches are just executed better, in one way or another. A pitcher may just say screw it, I’m going to throw my good pitch a lot, now! A pitcher may just get better at having to endure the psycho-emotional stress of doing a hard thing all alone on a hill with everyone watching and critiquing all the time.
So let’s try to figure out how Foltynewicz has reached this new tier of effectiveness, shall we?
Mike Foltynewicz’ Pitch Selection
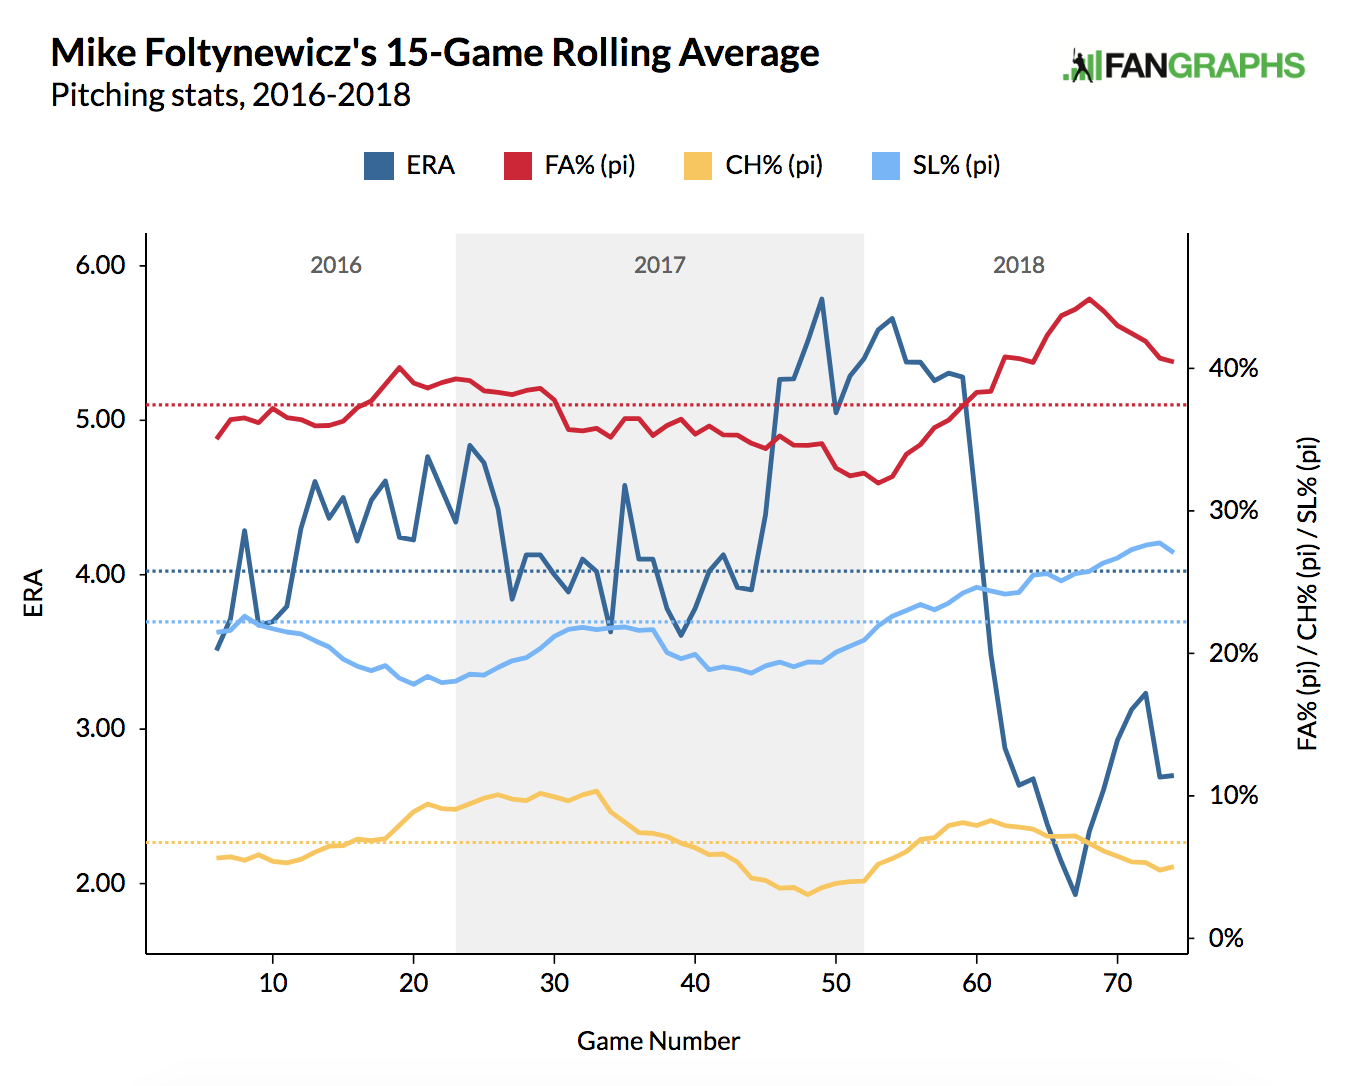
I was curious to find trends between pitch usage and Folty’s improvements in ERA, so I went a lookin’. Note that his trends in ERA and FIP more or less mirrored each other, so I’ll just speak in terms of ERA here to keep things neat and tidy.
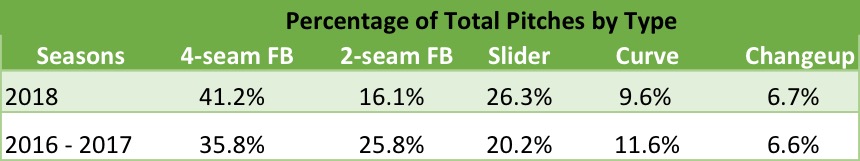
Looking at his fastball usage since he started seeing regular action in 2015, I noticed that Folty’s 2-seam fastball, or sinker as it’s now more commonly called, has pretty much stunk. It has been about 80th best among qualified starters from 2015 to 2017. Perhaps because of this, Foltynewicz has greatly reduced his use of it in 2018, and replaced it with the superior four-seamer. So we have something here; he’s throwing the better of his two fastballs more and the worse of the two less. That should help to get things on the good foot.
Moving on to the secondary offerings, he’s throwing his curve less, despite it having been a decent-to-pretty-good pitch since 2016. I’d like for my curveball theory to be relevant here, but it isn’t, and I’m going to leave it out of this analysis from here forward for sake of clarity and word count.
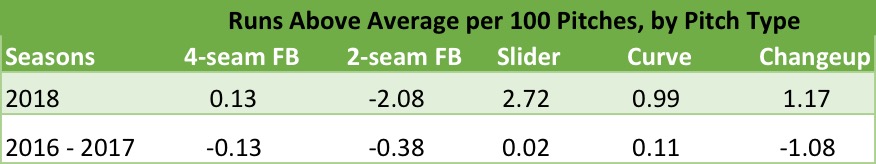
While the changeup isn’t being featured prominently in the mix, it’s being used slightly more often, and it’s suddenly much more effective. Among qualified starting pitchers that use their changeup at least 5% of the time, the pitch comes in at a healthy 15th best in the league so far, by runs above average per 100 pitches. Here’s more on that stat if you’re curious.
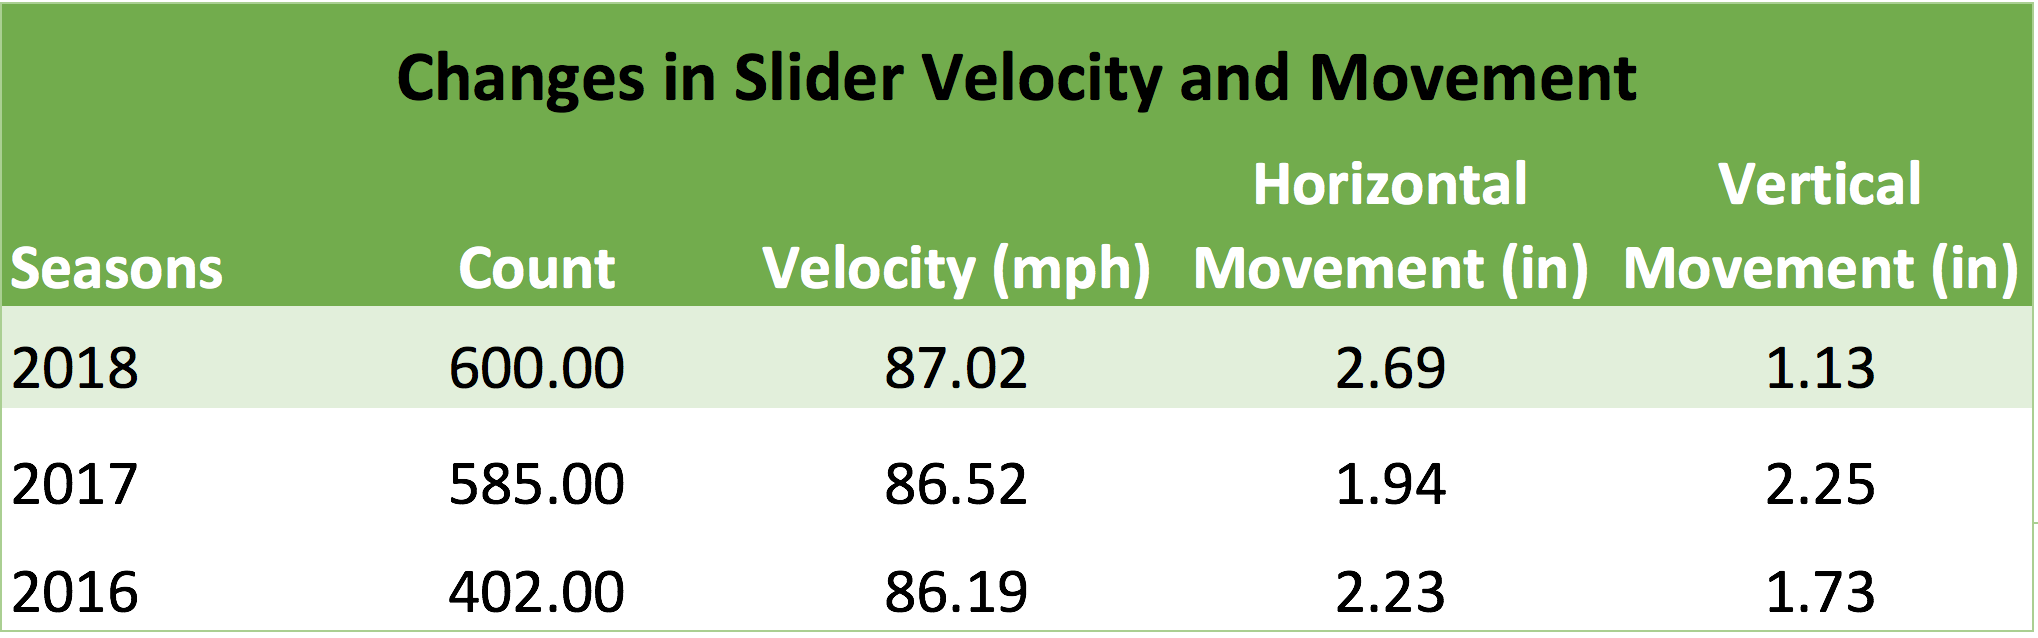
This brings us to the slider, which presents us with the second notable change in Folty’s pitch mix in 2018. He’s currently throwing the pitch at a rate of 26.7%. This is much more often than in 2017 and 2016, when he threw the pitch at 21.2% and 19.0%, respectively.
Here, we are actually getting to the heart of the matter, because not only has the slider been more common, it’s rather suddenly become an elite pitch. Again among qualified starting pitchers that use their slider at least 5% of the time, Folty’s shows up as the sixth most effective in all of MLB. That’s some hot shit right there, folks.
The improved slider and changeup are both VERY big upgrades from last year, when the slider was basically an average offering and the changeup was bad. Like, 107th out of the 125 starting pitchers that threw at least 100 innings bad.
So the changes in pitch mix so far look like a pitcher maximizing his strengths. He’s choosing the better of his two fastballs more often. He’s throwing his slider more as it has become emerged as a great pitch, and he’s continued to mix in a changeup that has somehow gotten better results this season.
This still leaves one important question, though. Why are the changeup and slider so much better this year, particularly the latter?
Why Are Mike Foltynewicz’ Pitches Better This Year?
The following are location heat maps for the Foltynewicz slider, blinking between 2018 and 2016-2017, and with pitches against righties and lefties separated. They serve as a visual of how the location of his slider deliveries have changed. Redder means a lot of ’em, bluer means less of ’em.
Data courtesy of Brooks Baseball. Keep scrolling for a breakdown.
With the slider against lefties, Folty is more often avoiding problem areas, namely center cut and middle-down locations, and attacking down-and-in and up-and-in locations more often. To righties, he’s throwing more of them for strikes, especially low in the zone, and missing low and away to those hitters less often.
Those of us who have applied the ol’ eye test for a few years might notice something that we can feel from that last bit; Foltynewicz is throwing far fewer of those non-competitive sliders that were so far down-and-away to righties that there was no chance that the hitter would chase.
Switching to the changeup, he’s more consistently spotting the pitch in the low-outer quadrant to lefties, while rarely throwing the it to righties. This seems like good execution of some conventional wisdom. Utilize the changeup to keep lefties off of the fastball – they get a better look at it, after all – and mostly keep it on the shelf against righties, who may benefit from fewer high-nineties heaters and wipeout sliders.
The changeup heat maps:
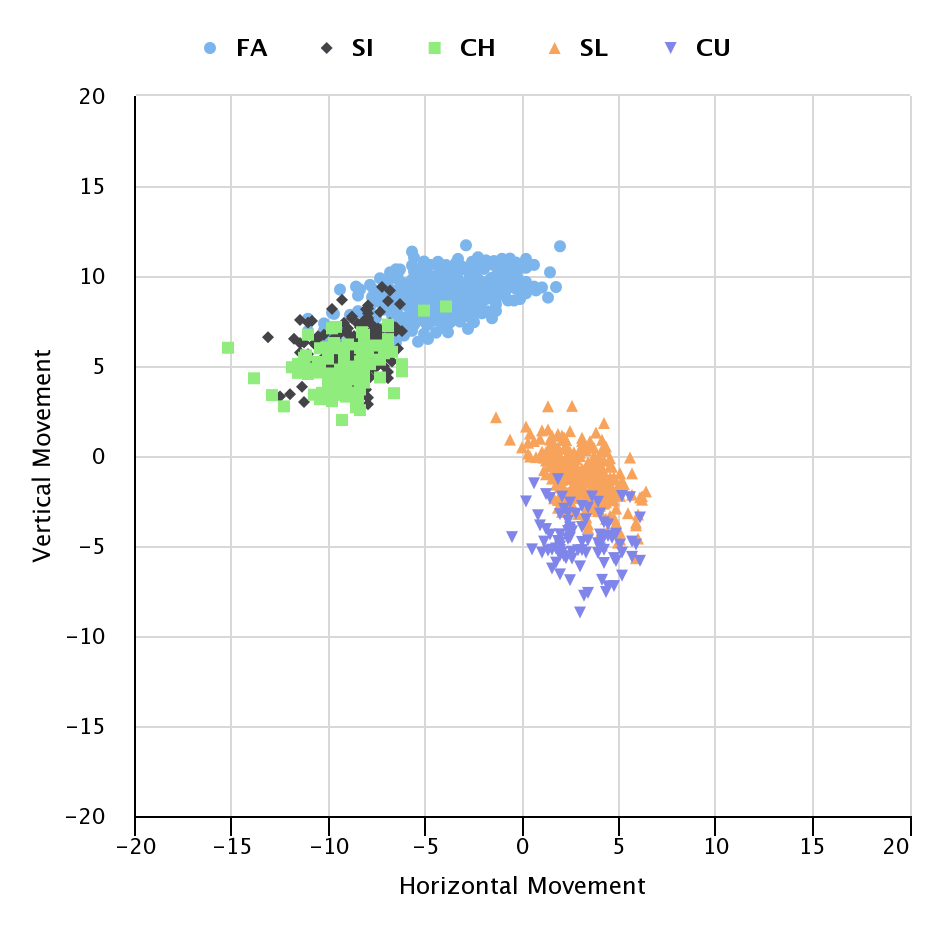
Of all the details we’ll touch on in this post, I think that most of the meat and potatoes can be found here. The movement profile of the Foltynewicz slider has changed, especially relative to last season. Horizontal movement is up, and vertical movement is noticeably reduced.
It’s a very imperfect science to track down video to compare how a player was and is, but here is the Foltynewicz slider circa 2017…
…and circa 2018.
There’s no golden ratio for a slider’s three-dimensional movement, but the 2.0 version of this pitch has been a huge step forward in 2018, and there does seem to be a difference in how these two pitches are behaving in space-time.
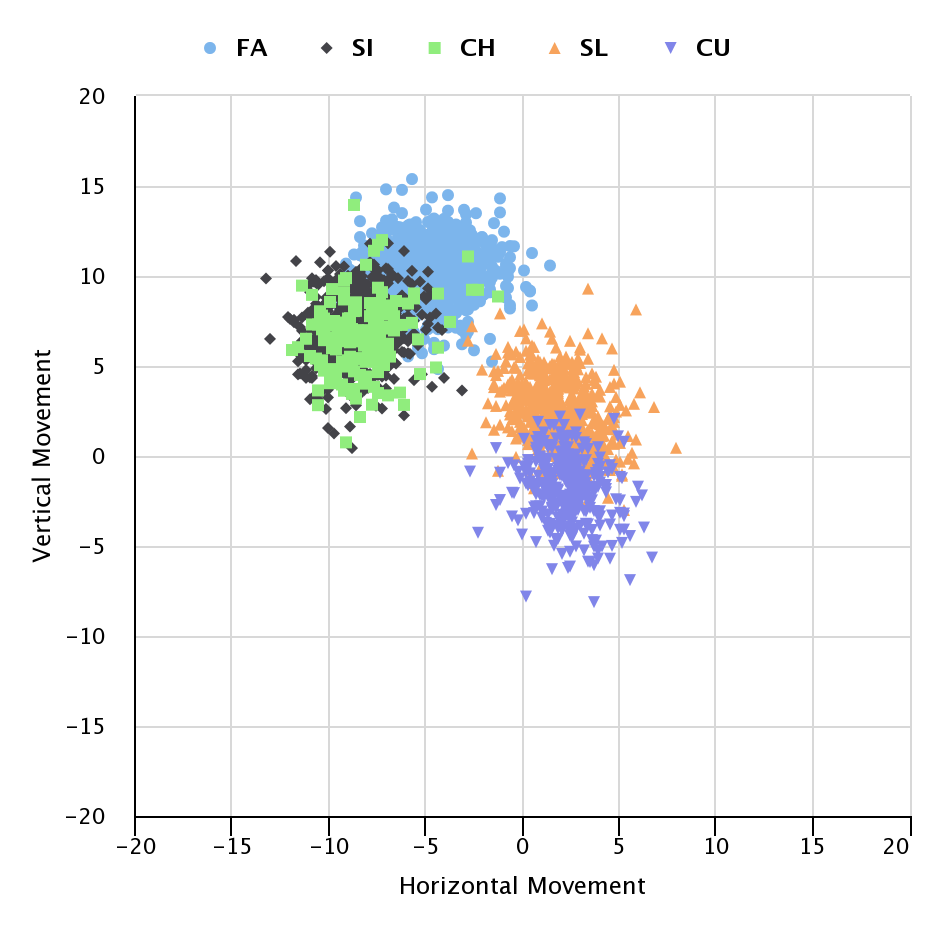
That’s supported by these two scatter plots, lifted from a Fangraphs article posted earlier this year. The first is from 2017 and the second from 2018, and they both plot vertical movement against horizontal movement to give a profile of how a pitch behaves. We see two things about the 2018 slider. It’s clearly moving differently, and the tighter grouping in the second plot indicates a pitch that is now being executed with more consistency. The slider is the red-orange clump on both plots.
Interestingly, en route to giving up less contact overall this season, he’s actually getting fewer swings and misses on all pitches except his slider. It has single-handedly improved his ability to avoid contact.
The slider has gone from being his most homer-prone pitch in 2017, to the 2nd least likely to leave the yard this season, significantly contributing to a lower rate of home runs overall this season.
In 2017, against the slider, hitters managed a batting average of .197, and slugged .409. This year? .122 and .213, respectively.
I’m starting to detect a trend here.

The Results
Folty has said that he worked on the slider a lot during the offseason. Players say a lot of things, as do announcers. This is how our favorite baseballers can be in the best shape of their lives every season, for example. But in this case, I think the narrative checks out.
The slider has been leaps and bounds better this season, and Foltynewicz’s other pitches seem to be riding its coattails.
This makes a lot of intuitive sense to me. When hitters are faced with an elite slider being located well and thrown often, it’s only natural that a previously so-so four seamer and changeup will become more effective, as well. Especially when they, too, are being located more optimally. If you can’t eliminate any of the three, all three are harder to handle.
This is the sort of pitch mix synergy that separates effective starters from effective relievers.
It’s also the sort of thing that has us talking about Mike Foltynewicz in terms of a potential Game 1 Postseason Starter, when we were just wondering if he was destined for the bullpen as recently as last season.
Given a clean bill of health, I see no reason to doubt Foltynewicz’s ability to pitch very well, well into the future. When your stuff is so good that you can shelve a sinker that averages 97 mph, the sky is the limit.
I still think he should throw the deuce more.

Excellent Article!