Recently, I defined and identified the “aces” of major league baseball using a statistical methodology with a very high bar a pitcher must reach in order to be considered an “ace.” Doing so, I identified only five current aces along with four pitchers who have the potential to be an emerging ace. Read all about that by clicking here.
Today, I want to go about identifying aces in a way that is simpler to understand, fun, and a little less restrictive. This method should draw a few more names into the discussion, and I’m curious to see who they are.
The link above has the full methodology and how I went about defining “ace,” but to quickly recap (feel free to skip this first section if you read the other article)…
Three criteria are needed to consider a pitcher an ace:
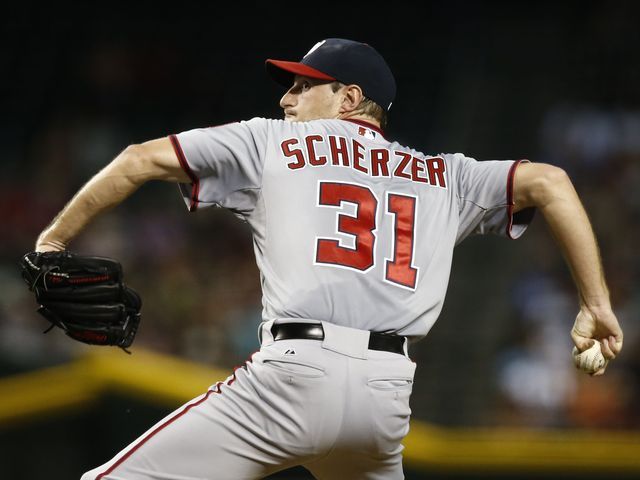
Dominance: Dominance is defined for my purposes in terms of “run suppression,” which is the main job of a pitcher. I used two rate stats to measure run suppression. The first is Earned Run Average (ERA), a traditional stat that we all understand. It reasonably measures run suppression by letting us know how many runs were attributed to the pitcher while the pitcher was in the game (mostly). However, ERA is imperfect because there are many other factors that contribute to runs scoring other than the pitcher, and ERA does not consider these. The second is Skills-Interactive Earned Run Average (SIERA), an advanced stat that is harder to understand, but is scaled to parallel ERA (so a 3.00 ERA and a 3.00 SIERA are roughly the same). SIERA determines – to put it simply – how many runs a pitcher should have given up based on his performance as measured by variables such as ground ball rate, HR/FB rate, strikeout rate, and park factors. By using a traditional and advanced metric, I provide more context to for the resulting data. It will allow us to compare and contrast the lists.
Note that because these are rate stats, only pitchers with at least 150 innings in a season were included in the data set. That way, a pitcher with 20 dominant innings won’t be included. Clearly, a pitcher needs to pitch most of the season to be considered an ace.
Consistency: Dominance worthy of ace status can’t happen in a game here and there or only for one season. To be an ace, a pitcher has to have dominant seasons for multiple years. For the original data, I went back 10 years to get enough context. I considered each season individually, awarded a point for each season a pitcher was considered dominate by one of the stats, and summed the points. How I determine points is the major change for the current study, and I’ll explain that in a minute.
Separation from the pack: In my prior methodology, I argued that an ace can’t just be toward the front of the pack, they needed to be significantly better than the pack. They must stand out from the pack. To define this in my prior study, I defined “separation from the pack” statistically as two standard deviations better than the mean. I won’t explain that here because I’m eliminating this requirement to loosen the restrictions a bit. But I do discuss it in the other article.
Changes for current method of determining ace:
For this funner, simpler version, I am modifying the last requirement. Instead of using a boring statistical measurement to make sure the pitchers are separated from the pack, I’m simply going to use the top five pitchers each year based on ERA and SIERA. If I were to simplify how I conceptualize what makes a pitcher an “ace” into one statement, at least for the current method, it would be this: If you could pick any five pitchers from baseball to make one rotation, those five pitchers would be the ones who qualify as the aces of baseball. It’s not one ace for each team or a total of 30 aces to match the number of teams. That allows mediocre pitchers into the definition, and an ace requires excellence. So along those lines, I decided to award points to those who finished in the top five of ERA and the top five of SIERA for each season.
A second change is shortening the time frame of years considered from 10 years to five years (2012-2016). I was getting too much older data from pitchers no longer relevant to the current discussion. This change helps the data fit better into the context identifying current aces.
How “Points” will be awarded to determine aces:
So now for the fun part. To determine the aces, there will be points awarded to each pitcher who finishes in the top five of ERA and in the top five of SIERA for each season. The points will be reverse ordered. So if a pitcher finishes 1st in ERA in 2012, he will get 5 points for that season. If a pitcher finishes 2nd in ERA in 2012 he will get 4 points, finishing 3rd earns 3 points, 4th earns 2 points and 5th earns 1 point. The same will be done for the SIERA list. The points for each year will then the summed to determine who has the most “ace points.” The lists for ERA and SIERA will not be combined for some additional fun in comparing and contrasting the traditional stat list with the advanced stat list.
A final update comes out of the discussions surrounding the first article. I’ve decided to reward more recent performances more heavily by awarding them more points. This is consistent with how we evaluate pitchers (most recent performance = more important). It also fits the goal of trying to identify current aces. So what we will do is award one bonus point for finishing in the top five in 2014 or 2015, and award two bonus points for finishing in the top five in 2016. In other words, if you finish 1st in 2014 or 2015, you will get 6 points instead of 5 (and 5 instead of 4 and so on). In 2016, if you finish 1st, you will get 7 points instead of 5 (and 6 instead of 4 and so on).
This is pretty simple to understand, so let’s score the seasons and see season to season point totals for each pitcher. Then we will sum the points for each pitcher to see who sticks out:
Aces by ERA:
| Year | Name | Team | SIERA | Points |
|---|---|---|---|---|
| 2012 | Clayton Kershaw | Dodgers | 2.53 | 5 |
| 2012 | David Price | Rays | 2.56 | 4 |
| 2012 | Justin Verlander | Tigers | 2.64 | 3 |
| 2012 | R.A. Dickey | Mets | 2.73 | 2 |
| 2012 | Johnny Cueto | Reds | 2.78 | 1 |
| 2013 | Clayton Kershaw | Dodgers | 1.83 | 5 |
| 2013 | Jose Fernandez | Marlins | 2.19 | 4 |
| 2013 | Matt Harvey | Mets | 2.27 | 3 |
| 2013 | Anibal Sanchez | Tigers | 2.57 | 2 |
| 2013 | Zack Greinke | Dodgers | 2.63 | 1 |
| 2014 | Clayton Kershaw | Dodgers | 1.77 | 6 |
| 2014 | Felix Hernandez | Mariners | 2.14 | 5 |
| 2014 | Chris Sale | White Sox | 2.17 | 4 |
| 2014 | Johnny Cueto | Reds | 2.25 | 3 |
| 2014 | Adam Wainwright | Cardinals | 2.38 | 2 |
| 2015 | Zack Greinke | Dodgers | 1.66 | 6 |
| 2015 | Jake Arrieta | Cubs | 1.77 | 5 |
| 2015 | Clayton Kershaw | Dodgers | 2.13 | 4 |
| 2015 | David Price | - - - | 2.45 | 3 |
| 2015 | Dallas Keuchel | Astros | 2.48 | 2 |
| 2016 | Kyle Hendricks | Cubs | 2.13 | 7 |
| 2016 | Jon Lester | Cubs | 2.44 | 6 |
| 2016 | Noah Syndergaard | Mets | 2.60 | 5 |
| 2016 | Madison Bumgarner | Giants | 2.74 | 4 |
| 2016 | Johnny Cueto | Giants | 2.79 | 3 |
| Name | 2012 | 2013 | 2014 | 2015 | 2016 | Total |
|---|---|---|---|---|---|---|
| Clayton Kershaw | 5 | 5 | 6 | 4 | 20 | |
| Zack Greinke | 1 | 6 | 7 | |||
| Johnny Cueto | 1 | 3 | 3 | 7 | ||
| David Price | 4 | 3 | 7 | |||
| Kyle Hendricks | 7 | 7 | ||||
| Jon Lester | 6 | 6 | ||||
| Felix Hernandez | 5 | 5 | ||||
| Jake Arrieta | 5 | 5 | ||||
| Noah Syndergaard | 5 | 5 | ||||
| Chris Sale | 4 | 4 | ||||
| Jose Fernandez | 4 | 4 | ||||
| Madison Bumgarner | 4 | 4 | ||||
| Justin Verlander | 3 | 3 | ||||
| Matt Harvey | 3 | 3 | ||||
| Adam Wainwright | 2 | 2 | ||||
| Anibal Sanchez | 2 | 2 | ||||
| Dallas Keuchel | 2 | 2 | ||||
| R.A. Dickey | 2 | 2 |
Aces by SIERA:
| Year | Name | Team | SIERA | Points |
|---|---|---|---|---|
| 2012 | Stephen Strasburg | Nationals | 2.88 | 5 |
| 2012 | Cliff Lee | Phillies | 3.07 | 4 |
| 2012 | Max Scherzer | Tigers | 3.07 | 3 |
| 2012 | David Price | Rays | 3.23 | 2 |
| 2012 | R.A. Dickey | Mets | 3.25 | 1 |
| 2013 | Matt Harvey | Mets | 2.63 | 5 |
| 2013 | Yu Darvish | Rangers | 2.76 | 4 |
| 2013 | Felix Hernandez | Mariners | 2.77 | 3 |
| 2013 | Cliff Lee | Phillies | 2.83 | 2 |
| 2013 | Chris Sale | White Sox | 2.89 | 1 |
| 2014 | Clayton Kershaw | Dodgers | 2.09 | 6 |
| 2014 | Felix Hernandez | Mariners | 2.50 | 5 |
| 2014 | Chris Sale | White Sox | 2.56 | 4 |
| 2014 | Corey Kluber | Indians | 2.61 | 3 |
| 2014 | Stephen Strasburg | Nationals | 2.64 | 2 |
| 2015 | Clayton Kershaw | Dodgers | 2.24 | 6 |
| 2015 | Chris Sale | White Sox | 2.52 | 5 |
| 2015 | Max Scherzer | Nationals | 2.63 | 4 |
| 2015 | Carlos Carrasco | Indians | 2.74 | 3 |
| 2015 | Jake Arrieta | Cubs | 2.75 | 2 |
| 2016 | Jose Fernandez | Marlins | 2.81 | 7 |
| 2016 | Noah Syndergaard | Mets | 2.95 | 6 |
| 2016 | Max Scherzer | Nationals | 3.05 | 5 |
| 2016 | Madison Bumgarner | Giants | 3.36 | 4 |
| 2016 | Michael Pineda | Yankees | 3.40 | 3 |
| Name | 2012 | 2013 | 2014 | 2015 | 2016 | Total |
|---|---|---|---|---|---|---|
| Clayton Kershaw | 6 | 6 | 12 | |||
| Max Scherzer | 3 | 4 | 5 | 12 | ||
| Chris Sale | 1 | 4 | 5 | 10 | ||
| Felix Hernandez | 3 | 5 | 8 | |||
| Jose Fernandez | 7 | 7 | ||||
| Stephen Strasburg | 5 | 2 | 7 | |||
| Cliff Lee | 4 | 2 | 6 | |||
| Noah Syndergaard | 6 | 6 | ||||
| Matt Harvey | 5 | 5 | ||||
| Madison Bumgarner | 4 | 4 | ||||
| Yu Darvish | 4 | 4 | ||||
| Carlos Carrasco | 3 | 3 | ||||
| Corey Kluber | 3 | 3 | ||||
| Michael Pineda | 3 | 3 | ||||
| David Price | 2 | 2 | ||||
| Jake Arrieta | 2 | 2 | ||||
| R.A. Dickey | 1 | 1 |
Conclusions
I’m going to leave you to draw your own conclusions about the specific aces, but I have a few bigger picture conclusions to note.
First, what is glaringly obvious – even though I overlooked it in my original analysis – is the clear bias toward National League teams, especially in ERA. For ERA points, 18 of the 25 pitchers represent the NL. For SIERA, that drops to 14 of 25, which is at least a little more balanced. It’s possible that the Senior Circuit just has better pitching during this stretch of years, but based on SIERA taking more variables into account beyond runs charged to the pitcher, it likely helps control for the Junior Circuit and its DH. It also helps control for pitcher friendly ball parks. Speaking of pitcher friendly parks, Dodger Stadium, which is regularly among the most pitcher friendly, gives an added boost to Clayton Kershaw in ERA. In other words, Kershaw has a lot going for him other than being an amazingly good pitcher.
Second, this bias is why I favor more advanced stats that adjust for park factors as well as considering other factors that influence run scoring besides the pitcher. They might not adjust for these factors perfectly, but this is a good example of how even the imperfect adjustments are a big step forward from the traditional stats that don’t consider them at all. Because of this, I lean heavily toward the SIERA list as the better list. I think the fact that the ERA list completely ignores Scherzer and minimizes Sale lends credence to this claim, even for those who typically prefer more traditional metrics.
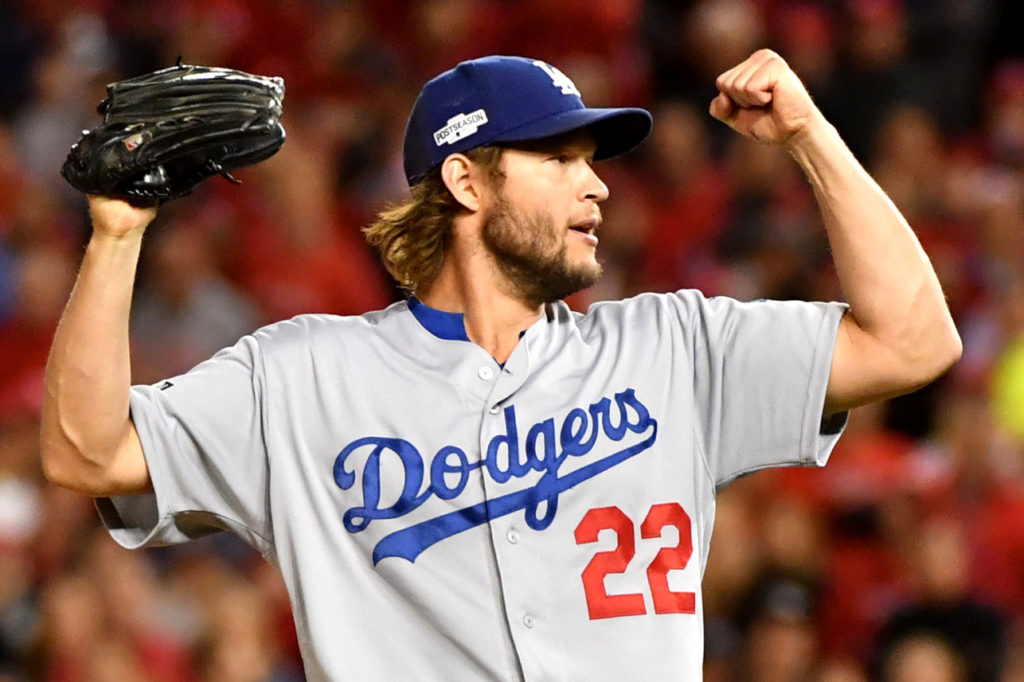
All that said, I still think Kershaw is clearly the best pitcher in the game in the last five years. He is the only pitcher who is in the top five of both list, and he is at the top of both lists. Consider this: he was leading MLB in ERA and SIERA in 2016 before his injury. He fell one inning short of qualifying for inclusion on my list, so his brilliant pre-injury 2016 is not even included in the data because he pitched 149 innings instead of 150 innings. His most recent start on July 3, 2017 is an example of why he is such a good pitcher. It’s not just because he took a no-hitter into the 6th inning in that game, but because it was the 75th time in 281 career starts that he’s given up 3 hits or fewer in a game, and it was the 76th time he’s given up zero runs in a game. He’s allowed fewer than two runs while going at least 7 inning in 142 of 281 career starts. That’s more than half his starts! Since 2012, he’s done it 102 times in 164 starts, that’s more than 62% of his starts! But how often does he have a bad game? Well, in those same 164 starts, he’s only allowed more than three earned runs in 18 of them, and he’s only gone fewer than five innings in four of them, and only two of those were because of poor performance. Yeah, he good. And he good not because he threw that no-hitter once, but because he is expected to dominate every game because he almost always does dominate every game, year-in and year-out. Kershaw is the standard; he is the current definition of an ace.
Now back from that Kershaw love tangent to my bigger picture conclusions….
Third, what surprised me the most is that in some ways these point lists are just as restrictive as my more statistical methodology of determining aces. In that list, to earn a point, a pitcher had to be statistically different from the mean by having an ERA or SIERA that was roughly 98% better than the average for that season. Each time they topped that mark on either list, they earned one point for that season. There were a couple of years where no pitcher even qualified because of the high bar set and because the method did not require any pitchers to qualify. It was my assumption that the methodology I used here, which awarded points to the top five in each category no matter what, would yield more qualifying pitchers. While it did yield more pitchers, what’s interesting is how few earned points in more than one season, especially recent seasons. To me, to be an ace of the game, you have to be a top-end pitcher across seasons, but only a handful of guys managed to stay in the top five of either run suppression metric more than once during that time frame. There are only four pitchers who appear more than once on the ERA list: Kershaw, Zack Greinke, Johnny Cueto, and David Price, and the last two are not really in the conversation for current aces in my opinion. There are six pitchers who appear more than once on the SIERA list, but only three are performing at a high level more recently: Kershaw, Max Scherzer, and Chris Sale (and arguably Stephen Strasburg…when healthy). Cliff Lee retired and Felix Hernandez has been off for a couple of years now.
At the end of the day, based on data through 2016, I wouldn’t change my conclusions from the prior article, which might reveal a bias for my original list, or it might be because this second methodology confirmed my list and highlights the fact that there really aren’t that many elite pitchers out there no matter how you break it down.
My prior list also left open room for “emerging aces” and a few of those do make appearances here, such as Noah Syndergaard and Kyle Hendricks, even though these two are working themselves off the list this year due to performance and/or injury. I included Corey Kluber here even though he’s older because he’s breaking out, but he is reasonably in the conversation for already ace. In my opinion, his performance has him in a borderline category with this year potentially pushing him upward.
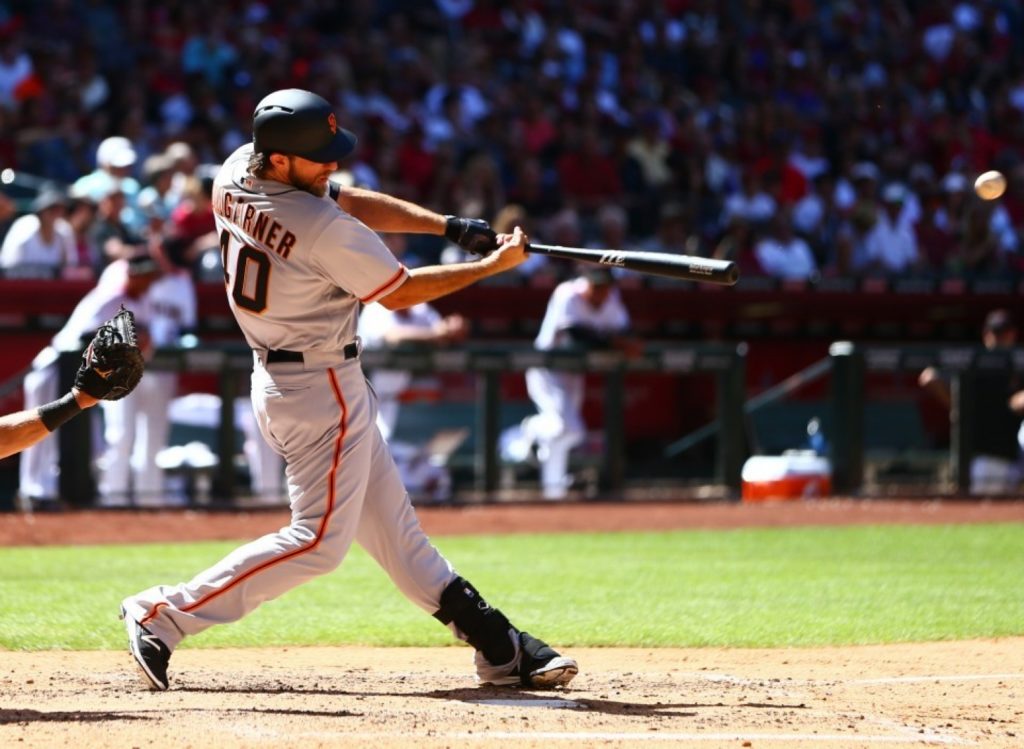
There are three names of interest to me that pop up using this method that didn’t using the original method. The first was the most popular name in the discussion generated from my first list – especially considering he wasn’t mentioned in the data or the article – and that’s Madison Bumgarner. The 27-year-old could fall into the emerging ace category, and many considered post-season success when pointing him out, which I do not address in my methodology. He also should get some bonus points for his ability to help himself on offense, too, or even another pitcher as a pinch hitter. His regular season performance should count for something, though, and it is too often in the really-good-not-elite category for my high standards. The second name is out of left field, and that’s Michael Pineda. He snuck onto the end of the SIERA list for 2016, but I’m not holding my breath that he’ll emerge into an ace. I’m willing to be surprised, though…very surprised. The third is Cueto, who isn’t great right now, but who I’ve apparently undervalued in discussions of aces from the past few years based on ERA; however, SIERA sees him more as I do, another really-good-not-elite pitcher.
What about this year?
While we need a full season of data to assess properly, when considering current aces, some context from the current season is helpful. So here are the tables for top 10 in ERA and SIERA at the half way point of 2017, along with the point totals they would earn if the season ended today. Obviously, a lot can change on these lists between now and October, but there are more interesting names for potential emerging aces on this list than there were for the previous five years, such as Alex Wood, Dallas Keuchel, and Lance McCullers. Also, Sale and Scherzer are on pace to cement their status as current aces, and even surpass Kershaw in the argument for ace of aces on the SIERA list. A little more perspective of time is needed, but it looks as though we are in a transition period for elite pitching. A few new aces are arising from the youth as a few of the former young guns settle in as established veterans. Ah, there’s nothing to make you feel old like the cycle of baseball.
Feel free to consider these top 10 lists in any resulting conversations you have from my research, and feel free to have some of that conversation in the comments:
| Name | Team | IP | Age | ERA | Points |
|---|---|---|---|---|---|
| Dallas Keuchel | Astros | 75.2 | 29 | 1.67 | 7 |
| Alex Wood | Dodgers | 73.2 | 26 | 1.83 | 6 |
| Max Scherzer | Nationals | 120.2 | 32 | 1.94 | 5 |
| Clayton Kershaw | Dodgers | 123.1 | 29 | 2.19 | 4 |
| Jason Vargas | Royals | 101.1 | 34 | 2.22 | 3 |
| Chris Sale | Red Sox | 120.2 | 28 | 2.61 | -- |
| Lance McCullers | Astros | 87.0 | 23 | 2.69 | -- |
| Gio Gonzalez | Nationals | 107.1 | 31 | 2.77 | -- |
| Corey Kluber | Indians | 88.1 | 31 | 2.85 | -- |
| Chase Anderson | Brewers | 90.1 | 29 | 2.89 | -- |
| Through games July 4. Min. 70 innings pitched. | |||||
| Name | Team | IP | Age | ERA | Points |
| Name | Team | IP | Age | SIERA | Points |
|---|---|---|---|---|---|
| Chris Sale | Red Sox | 120.2 | 28 | 2.60 | 7 |
| Max Scherzer | Nationals | 120.2 | 32 | 2.70 | 6 |
| Alex Wood | Dodgers | 73.2 | 26 | 2.78 | 5 |
| Corey Kluber | Indians | 88.1 | 31 | 2.84 | 4 |
| Clayton Kershaw | Dodgers | 123.1 | 29 | 2.97 | 3 |
| Lance McCullers | Astros | 87.0 | 23 | 2.98 | |
| Dallas Keuchel | Astros | 75.2 | 29 | 3.12 | |
| Jeff Samardzija | Giants | 111.0 | 32 | 3.20 | |
| Zack Greinke | Diamondbacks | 109.1 | 33 | 3.22 | |
| Luis Severino | Yankees | 99.2 | 23 | 3.26 | |
| Through games July 4. Min. 70 innings pitched. |

Leave a Reply