
Learning on the Fly: Sabermetrics 101
Just the FIP
{Editor’s Note: This series is told from the perspective of a “traditional” stats fan learning about “new” stats. Here are his previous entries:
How should we evaluatue a Pitcher?
It’s that time of year, again; your annual dose of my Sabermetric musings. The last two Sabermetric 101’s dealt in the offensive category. This time, I think a bit of pitching value needs to be addressed. That being said, I thought I’d start with a metric we hear all the time from Sabermetricians when valuing a pitcher, and one you don’t hear as often. I wanted to hit on FIP, xFIP, and SIERA. But, because pitching metrics can be detailed and sometimes a slog to navigate or understand, I’ll only just go over FIP (plus, this became a larger undertaking than I originally had thought and by the time I was happy with the FIP part, I was already at almost 1000 words).
Fielding Independent Pitching (FIP)
In a nutshell, FIP accounts for a pitcher’s run prevention, independent of the defense’s performance. It stands to reason, then, why the name Fielding Independent Pitching is what it is. Pitcher’s should be evaluated as a single entity, and shouldn’t include the fielding prowess, or lack thereof, from the defense behind them. A pitcher can’t control what the other eight players do, or don’t do. Thus, FIP has shown to be better predictor of ERA than ERA actually is.
I’ll give an example of this at the end, but the main differentiating factor between FIP and ERA is that ERA is a gauge for a team’s performance with a particular pitcher on the mound. FIP is a gauge of a particular pitcher’s performance alone.
So, now knowing that, then we should look at what a pitcher CAN control. According to the formula below, we know pitchers can control (to an extent) home runs, walks, hit batters, and strike outs. A factor they can’t control, though, is innings pitched. Now, it’s not abnormal for a pitcher to have a slightly higher FIP than ERA. However, large deviations between FIP and ERA could indicate positiviely or negatively depending on how the defense performs behind him, luck (good or bad), and even just random flukes.
For that, we go to the formula for calculating FIP. That formula is as follows:
FIP = ((13HR) + (3(BB + HBP)) – (2*K)/IP + the FIP constant.
Of course, as with all intricate equations and math in general, you have to find the constant. Thankfully, FanGraphs helps us with that also. The formula for FIP Constant is:
FIP Constant = lgERA – (((13lgHR)+(3(lgBB+lgHBP))-2*lgK))/lgIP)
PHEW!!! That’s a mouth-full. Obviously, if you’re trying to determine a league constant to measure all pitchers, you need a constant (or the way I look at it, a common denominator). Since 2003, the FIP constant has been slightly higher than 3. In 2017, the constant was 3.158, according to FanGraphs. In other words, the FIP Constant gives you the league average for finding an individual FIP.
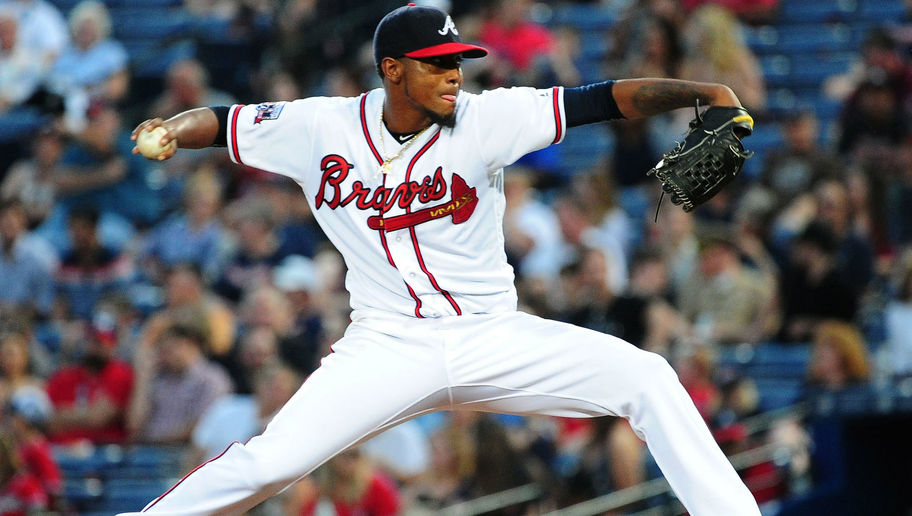
Let’s take Julio Tehran for example. We’ll look at three separate years. I chose three because it will give a better perception of value over time better than one year would. We all know about sample sizes.
Remember, for a particular pitcher, we want to use the FIP formula, not the FIP Constant. We already know the constant because FanGraphs has them listed for us (thank God).
NOTE: All values will be f-values (FanGraphs stats).
OK, so, in 2015 Julio surrendered 27 home runs, 73 walks, 9 hit batters, 171 K’s, and 200.2 innings pitched.
Now we put that into equation form.
FIP = ((1327) + (3(73 + 9)) – (2*171)/200.2 + 3.134 (2015 FIP Constant).
This equates to a 4.40 FIP. Julio’s 2015 ERA was 4.04. For the sake of time and space, I’ll skip the formula and just provide the numbers for 2016 and 2017.
Julio’s FIP in 2016 was 3.69 and his ERA was 3.21. In 2017, his FIP was 4.95 and his ERA was 4.49.
Based on this information, you can see that the defense helps keep that ERA down because no two hits, outcomes, or situations are the same. What it looks like FIP does, to me, is show you how much a pitcher really relies on his defense. Without a defense behind you, your value alone is worse. It’s a good thing baseball is a team sport.
Now, it’s not abnormal for a pitcher to have a slightly higher FIP than ERA. However, large deviations between FIP and ERA could indicate positiviely or negatively depending on how the defense performs behind him, luck (good or bad), and even just random flukes.
Guys liek Julio, who give up a lot of homeruns, tend to get the short end of the stick from FIP, while, pithers with high strike out and low walk rates come out looking better. Alternatively, pitchers with low k rates and throw a lot of ground balls tend to also get punished from FIP. This is mostly because the defense is involved.
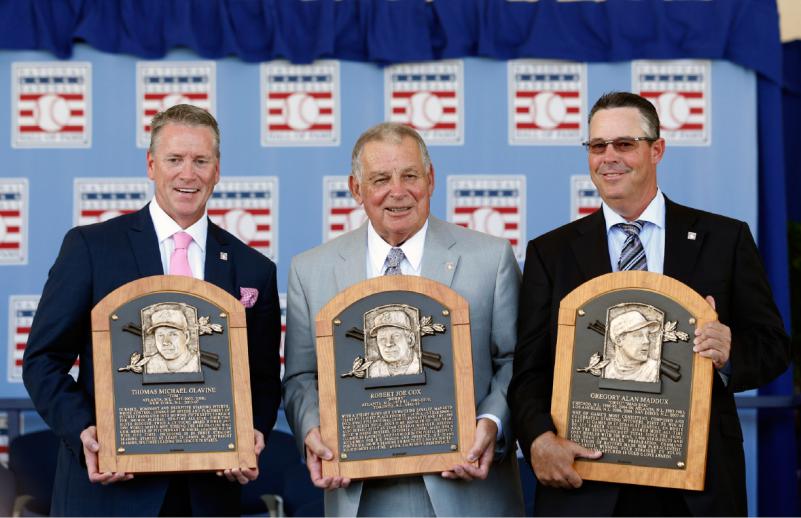
Let’s look at one more pitcher. Although for this one, let’s go old school. Let’s take a look at Tom Glavine’s 2002 season, his last season in Atlanta before going to the Mets. In 2002, Glavine put up a 2.96 ERA. Pretty good right? Normally, an ERA under 3 was considered pretty darn well. However, Glavine’s FIP in 2002 was a whopping 4.20.
Let’s even go further back on Glavine. In his 1991 season (his first Cy Young Award), Glavine compiled an ERA of 2.55 and his FIP was 3.06. The next year, in 1992, Glavine had a higher ERA at 2.76, but a lower FIP of 2.94. Thus, it could probably be argued that Glavine had a better season individually compare to 1991. He alone was able to lower his runs allowed under his own control.
As mentioned, FIP allows us to isolate performances. Unlike ERA, which is still useful, FIP shows us what Julio Teheran, Tom Glavine, or any other pitcher did by himself, based on what he alone can control. EAR still accounts for the defense behind you. Of course, like BABIP, luck also plays a role in this, but as I go through dissecting FIP, I think luck is less a factor in FIP than it is in ERA or even the BABIP against a pitcher.
Most traditional or casual fans would probably look at FIP and might think “ERA”. Well, a nicety of FIP is that it is easy to read and use. It reads and looks like ERA. The only real difference is that FIP acts as more of a starting point when looking to evaluate a specific pitcher’s performance.
For context, FanGraphs provides an estimate scale when trying to determine just what a good FIP IS. That scale is as follows:
3.20 = Excellent; 3.50 = Great; 3.80 = Above Average; 4.20 = Average; 4.40 = Below Average; 4.70 = Poor; and 5.00 or higher = Awful.
ERA and FIP are usually very close in value (i.e., 3.69 FIP vs. 3.21 ERA). As always, FIP is just one piece of the pie. There are other measures in which to consider pitching performance. For instance, a pitcher that can limit the running game of a team with a good to great pick-off move can help keep scoring down. That’s an instance that isn’t calculated into the formula for FIP.

Leave a Reply